|
The learning objectives of this chapter
 After
reading and completely understanding this unit, you will be able
to know: After
reading and completely understanding this unit, you will be able
to know:
·
The key factors which should be considered in determining how
far into the future an organization should try to plan.
·
Why the length of plans within organizations should vary
depending on the job level of the person planning.
·
The role of planning tools such as GANTT and PERT charts in
aiding short-term planning.
How far ahead should we plan?
There is no fixed rule which says precisely how far into the
future an organization should plan. There are, however, a
number of factors that should be considered carefully during the
process of deciding the time span to be covered. Among the
most important are:
(1) The expected degree of organizational
permanency
(2)
The size and complexity of the organization
(3)
The nature of the products or services
offered
(4)
The resources needed to implement the plan
The relationship between the job level and the
timing of planning
The particular job level or responsibility of any individual
within an organization has an important impact on the time
period for which that person should plan.
We can illustrate the relationship between the job level (the
hierarchy of the organizational structure) and the time spent in
planning in Figure 2.1.
Figure 2.1: Relationship between job level and timing of
planning
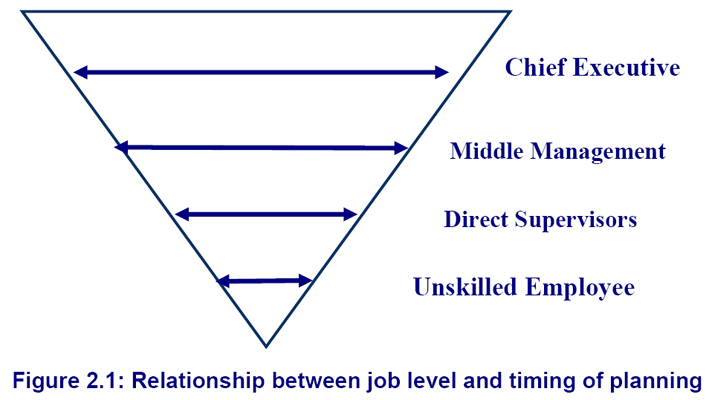
According to Figure 2.1, individuals at the top of an
organization have to take a longer view than any other person.
Conversely, those with the entry level responsibilities plan on
very short horizons.
The chief executive of an organization is
responsible for the survival and overall direction of the
organization. The person in that role should be thinking about
what could and should be done in the months, years, and possibly
generations ahead.
The middle manager, who is often charged with the
responsibility of one area or function within the organization,
must interrelate planning with other units of the organization
and with the organizational structure in which he or she
reports.
The direct line supervisor or manager may have
significant impact on the future of an organization but
typically has little personal involvement with the decisions
reached about the future.
The individual whose job requires specific skills
will confine most of his job planning to hours, days, and at
most weeks.
Methods / Techniques for Short-Term Job Planning
Among the most common are:
(a)
Gantt charts.
(b)
PERT system/charts.
2.1 Gantt Charts
 Gantt charts are very helpful where there is
little or no relationship between successive activities or where
the times to complete a task have been established. Unfortunately, such ideal conditions do not
always exist. Gantt charts are very helpful where there is
little or no relationship between successive activities or where
the times to complete a task have been established. Unfortunately, such ideal conditions do not
always exist.
Gantt chart is essentially a bar graph with time
on the horizontal axis and the resources to be scheduled on the
vertical axis. It is used for scheduling resources, including
management system inputs such as human resources and machines. We can illustrate this in Figure 2.2.
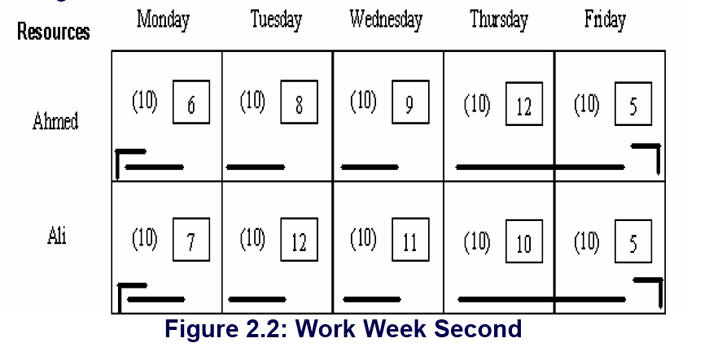
Figure 2.2: Work Week Second
|
( ) = planned units of production for
period, |
|

|
= actual units of production for period. |
|
┌
= when work is to begin. |
|
┐
= when work is to end. |
|
--
= percentage of work actually completed during a
time period. |
Figure 2.2 shows a completed Gantt chart for a work period.
The resources scheduled over the five workdays on this chart
were the human resources (Ahmed and Ali). During this week, both
Ahmed and Ali were supposed to produce 10 units a day. However,
the actual production deviated from planned production. There
were days when each of the two workers produced more than 10
units, as well as days when each produced fewer than 10 units.
Cumulative actual production for workweek shows that Ahmed
produced 40 units and Ali produced 45 units over the five days.
Features:
Although simple in concept and appearance, the Gantt chart has
many valuable managerial uses, these are:
First:
managers can use it as a summary overview of how
organizational resources are being employed.
Second:
from it, you can detect such facts as which resources are
consistently contributing to productivity and which are
hindering it.
Third:
managers can use the Gantt chart to help coordinate
organizational resources. The chart can show which resources are
not being used during specific periods, thereby allowing
managers to schedule those resources for work on other
production efforts.
Fourth:
the chart can be used to establish realistic worker output
standards.
|
 Key
Points to be Remembered
Key
Points to be Remembered